Technology we built from real work at the pond

AquaWise is software first. Some tools farmers can use today, others are still research we test with pilot farms, and we say plainly where each one stands. If you’d like to try one or build with us, talk to the team.

Available today · Pilot

Nong Nam, the farm record assistant in LINE

Speak, type or snap the log sheet. Nong Nam sorts it by pond and date, you check it before it’s saved, and you can look back in each pond’s diary.

  • Works in the LINE the team already uses every day. No new app to install.
  • Reads the numbers from a photo of the log sheet, and turns spoken notes into text.
  • The farm checks every value before it’s saved.
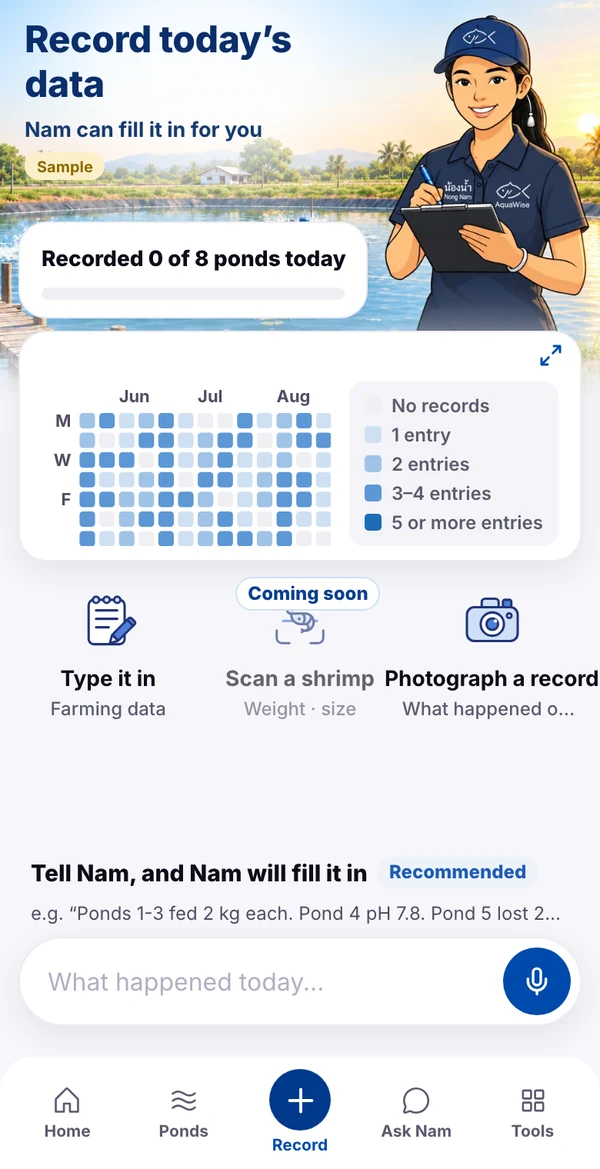
See it in use
Record screen of the Nong Nam app in LINE, with sample data
Beta · Coming soon

Shrimp Scan

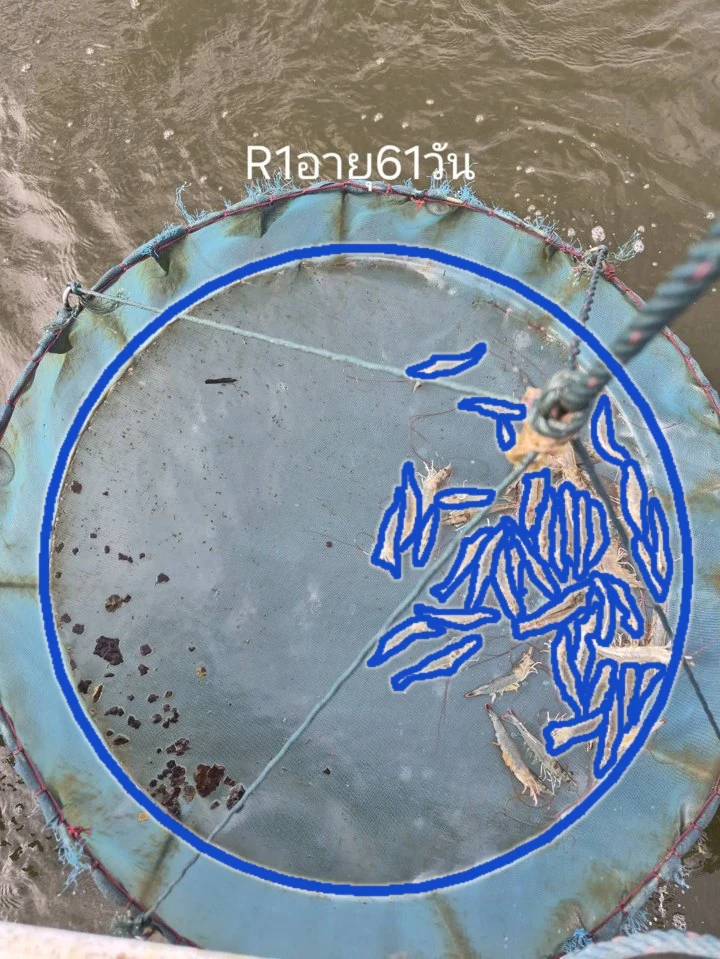
Lift the net and take one photo. Nong Nam counts the shrimp in the picture and estimates their average weight. Every scan adds to the pond’s growth curve.

  • Results are estimates. During the beta we suggest weighing a sample by hand as well.
  • One phone is all it takes, no extra equipment.
Register interest in Shrimp Scan
Real lift-net photo from pond R1 at day 61, with the shrimp the system counted marked in blue
Estimated average weight~9.2 g each
Measured from 35 shrimp
A real lift-net photo from a pilot farm. The blue marks are the shrimp the system counted. The result is one example measurement.
We’re still measuring its error against hand weighing.
Available now · Public

Shrimp market map

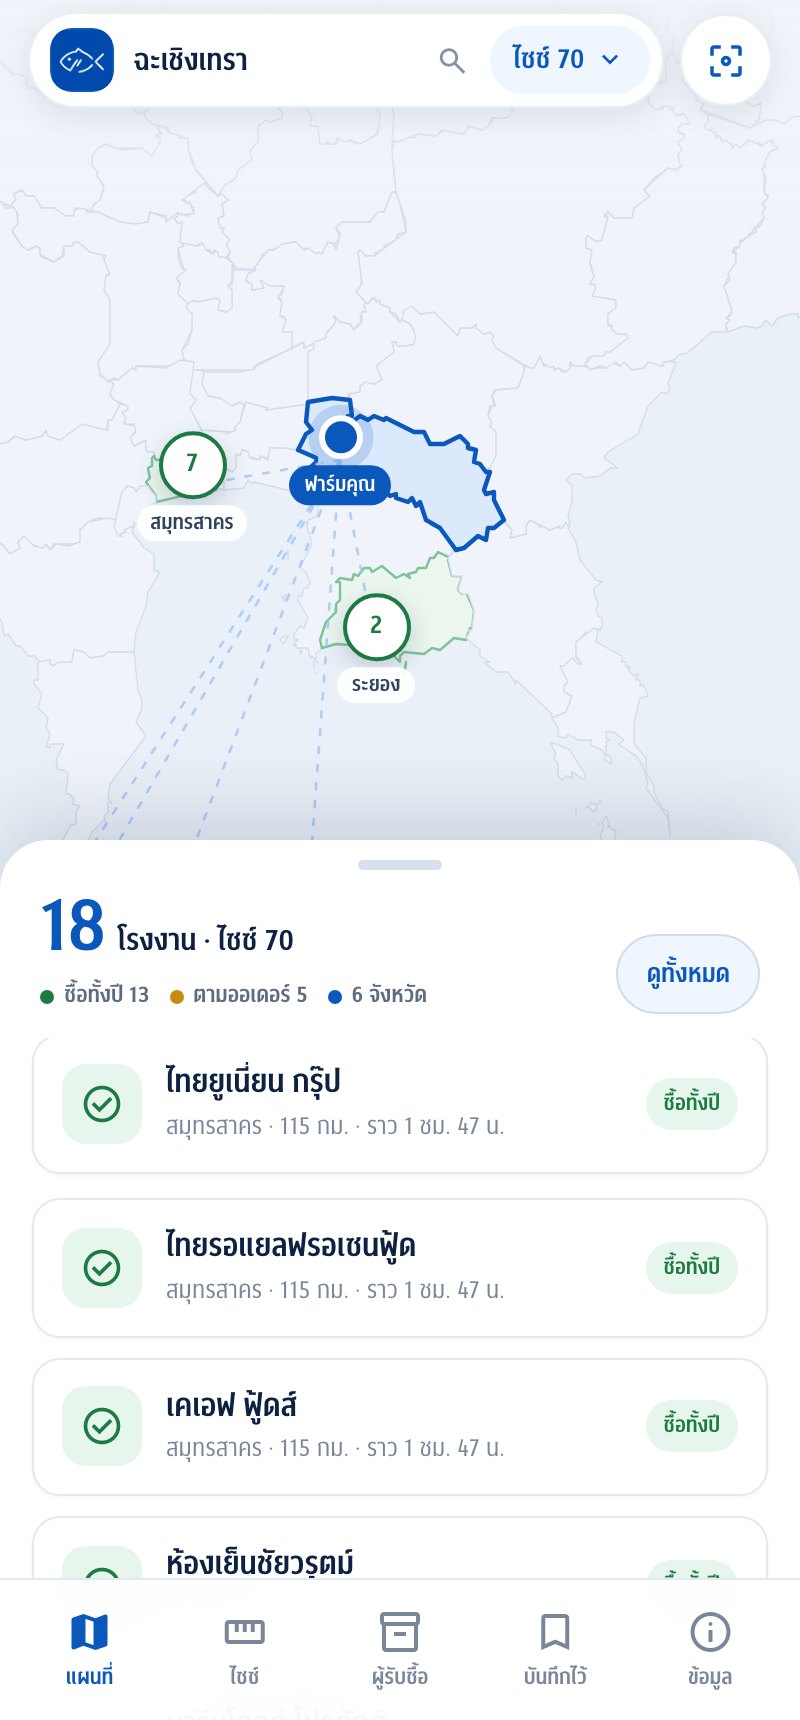
Which factory plans to buy which shrimp size, and how close it is to the farm, all on one screen. Open to anyone, no login needed.

  • Based on purchase plans from the Thai Frozen Foods Association, with the data date shown clearly.
  • These are purchase plans, not actual trades, and AquaWise is not a trading middleman.
Open the shrimp market map
Shrimp market map screen showing factories buying size 70 shrimp near Chachoengsao
Prototype · Simulated data

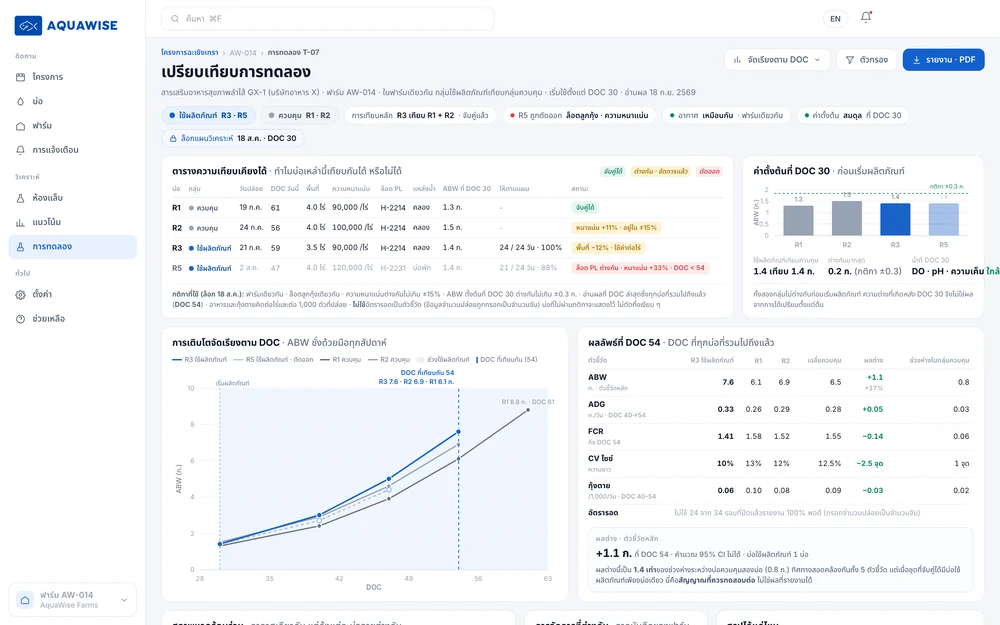
Dashboard for partners and agencies

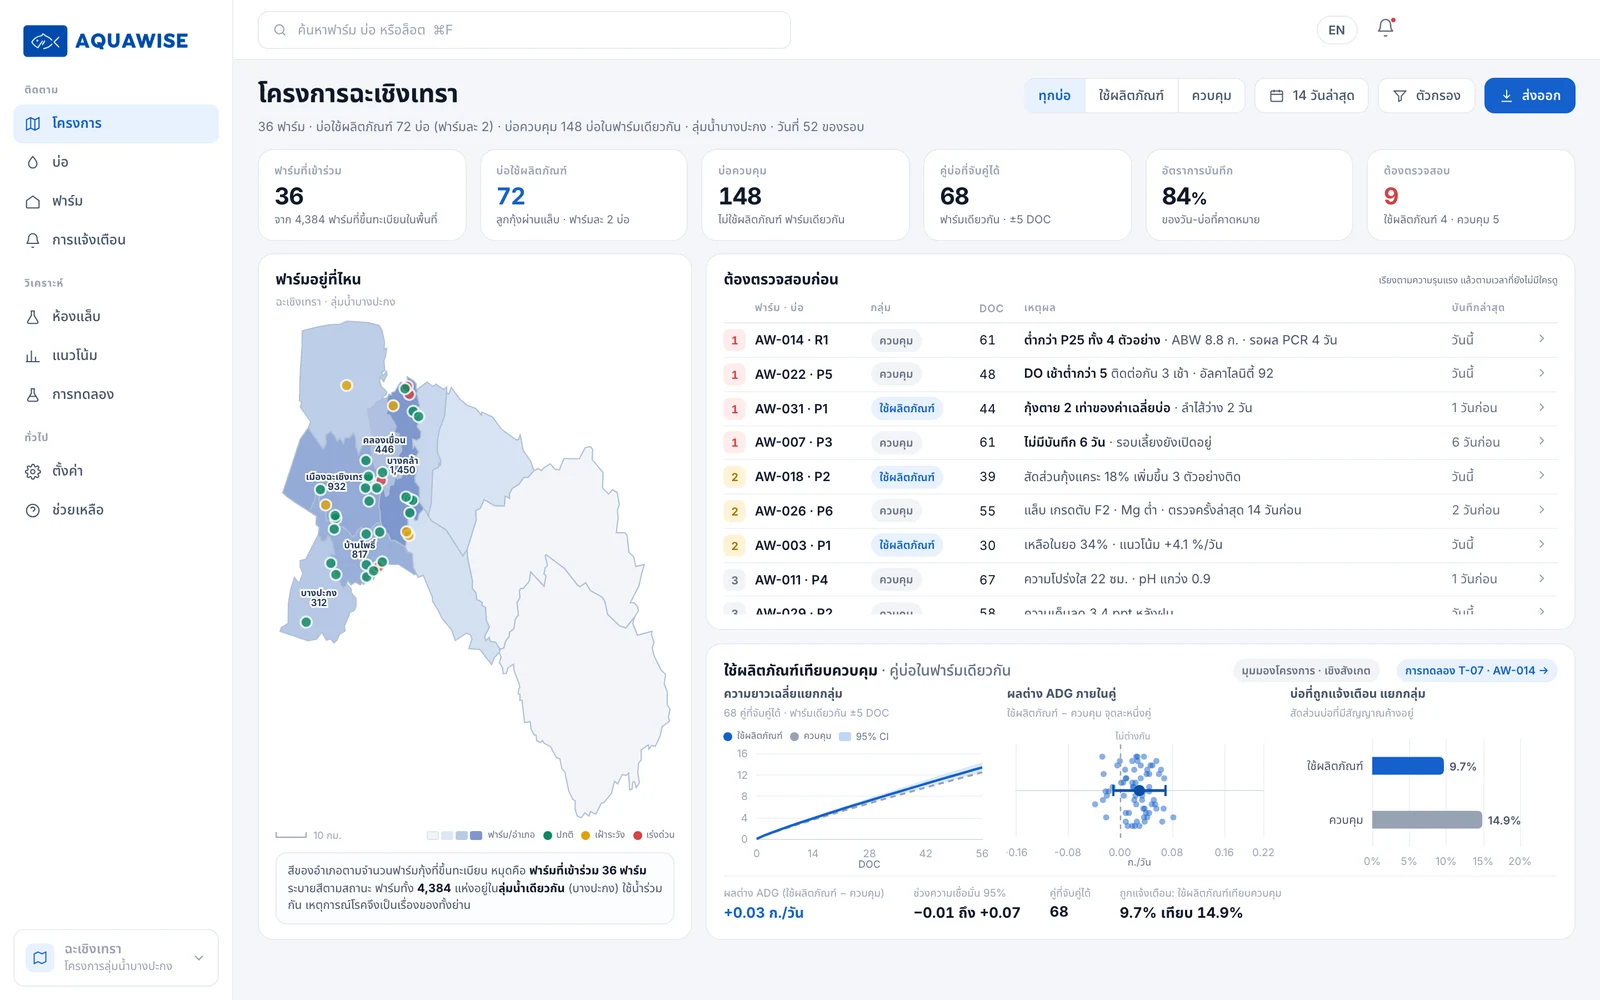
For organisations working with many farms, such as agency programs, research teams or product trials. See the whole program, drill into any pond, and compare side by side: same age, same farm, for example ponds using a product against control ponds.

  • Shows only data the farm has agreed to share.
  • Says clearly what can and can’t be concluded yet, and never judges in place of the experts.
Book a demo
Program overview screen: map of the program’s farms, summary figures, ponds to check first, and a chart comparing product ponds with control ponds
Program overview
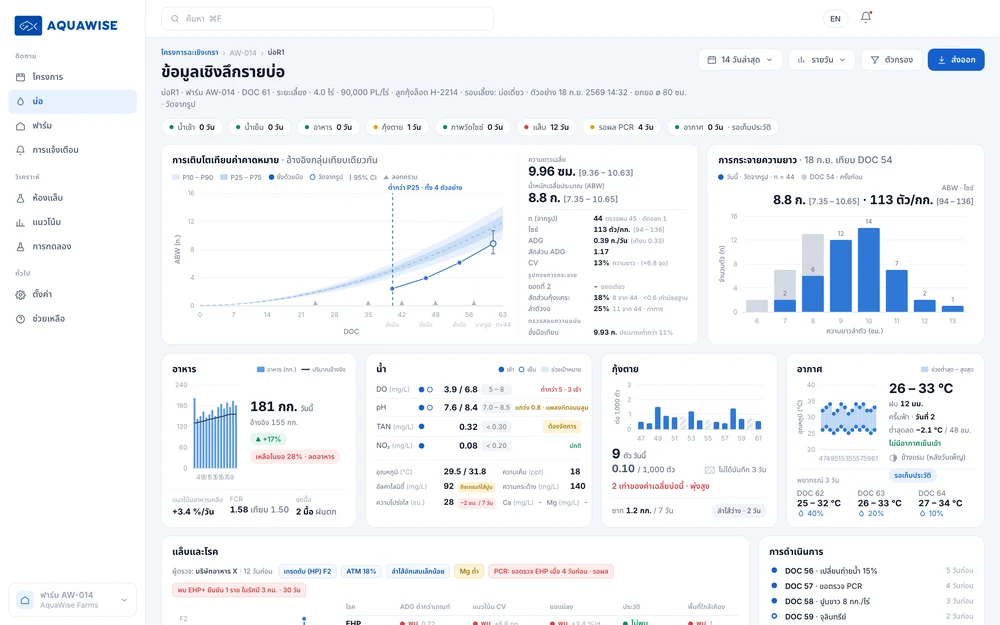
Pond detail screen: growth against expected, shrimp length distribution, feed, water, mortality and weather
Pond detail
Trial comparison screen: a table of how comparable the ponds are, growth by age, and results at the same age
Side-by-side comparison

Screens from the prototype. The farms and ponds shown are simulated data on the real data structure.

Internal tool

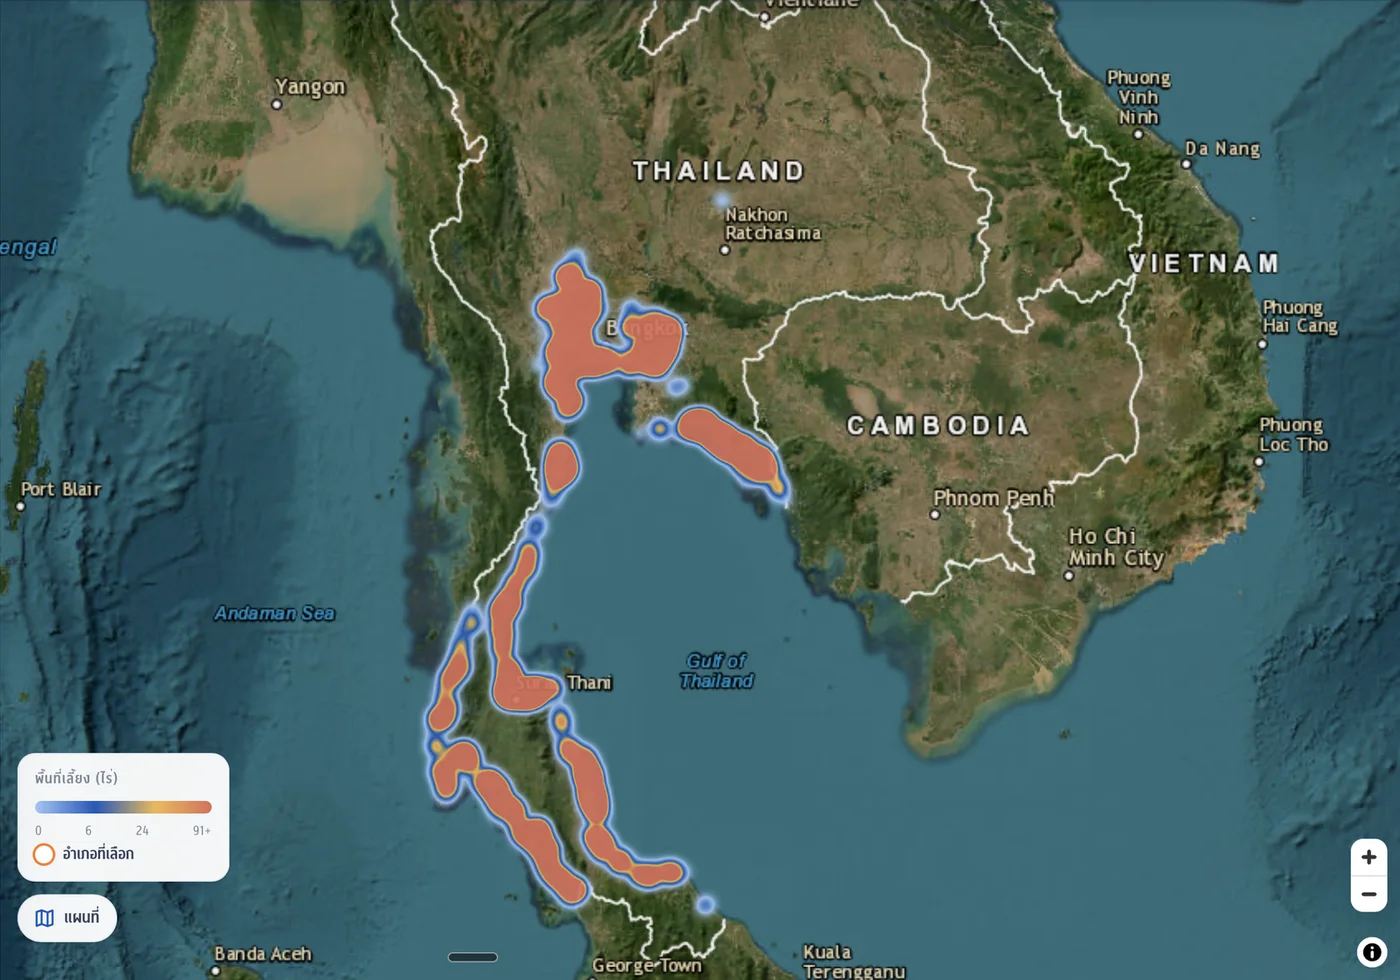
Shrimp farm map of Thailand

Built on open data from the Department of Fisheries, covering more than 21,000 registered whiteleg shrimp farms. It shows farming areas by district nationwide, so we can talk with agencies from the same picture.

  • Based on open data from the Department of Fisheries, updated to 2026.
  • Shown as district-level totals. No farm locations or farm-level data are revealed.
Map of Thailand shading whiteleg shrimp farming areas by district along the Gulf of Thailand and Andaman coasts
Base map: Esri World Imagery
Research

Automatic pond outlines from satellite images

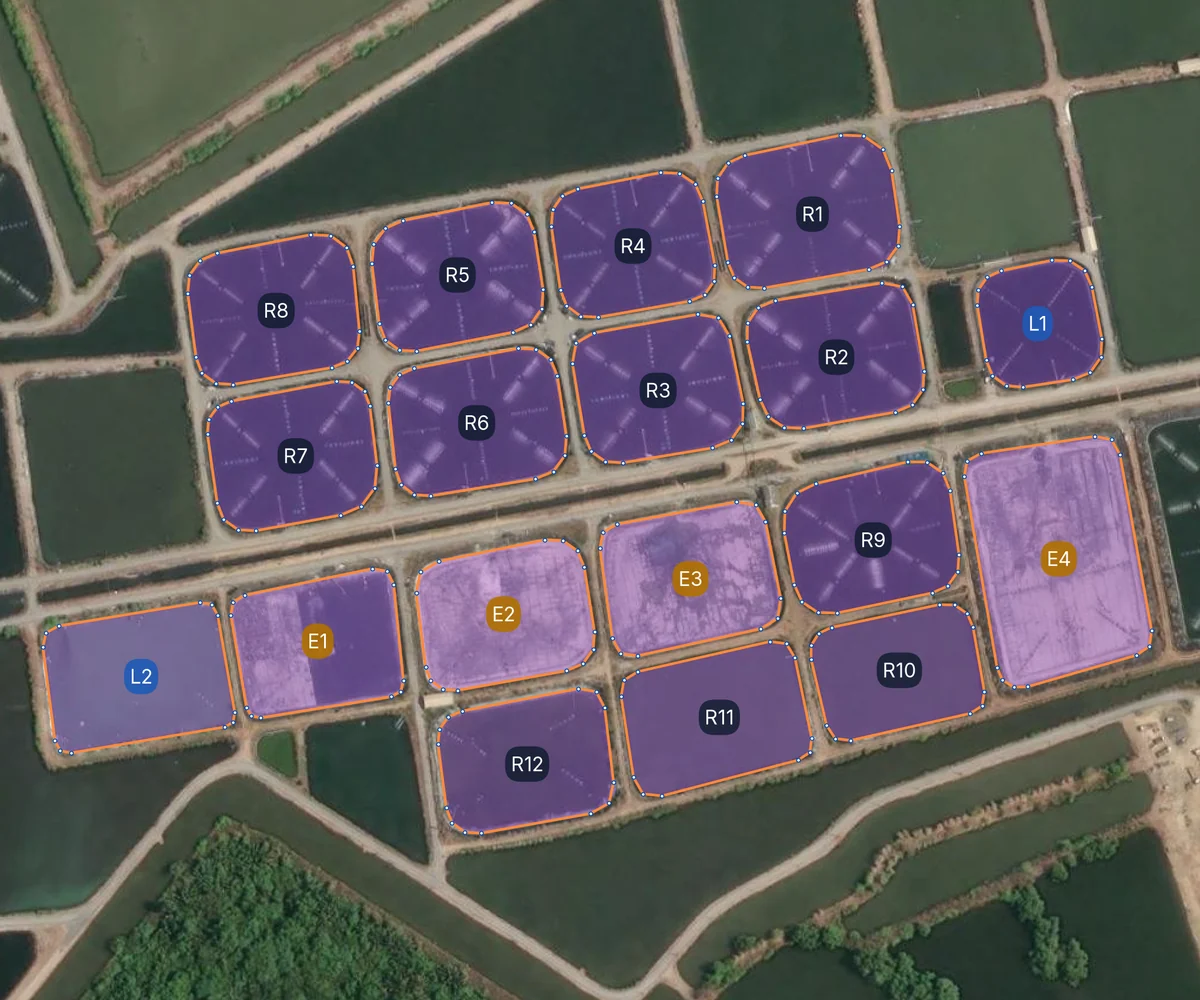
The system finds every pond on a farm in satellite imagery and draws its outline automatically, square or round, as clean shapes that are easy to adjust. The farm then confirms them, so setting up ponds for the first time is faster, with no drawing each pond by hand.

  • Tested on images of pilot farms
  • The farm confirms every outline. Nothing is saved automatically.
Satellite image of a shrimp farm where the system found and outlined all 18 ponds automatically, each labelled with its pond name
Example from a real farm: the system found and outlined 18 ponds on its own · Satellite imagery: Esri, Maxar, Earthstar Geographics
Research · Not yet calibrated against real ponds

Pond water-flow simulation

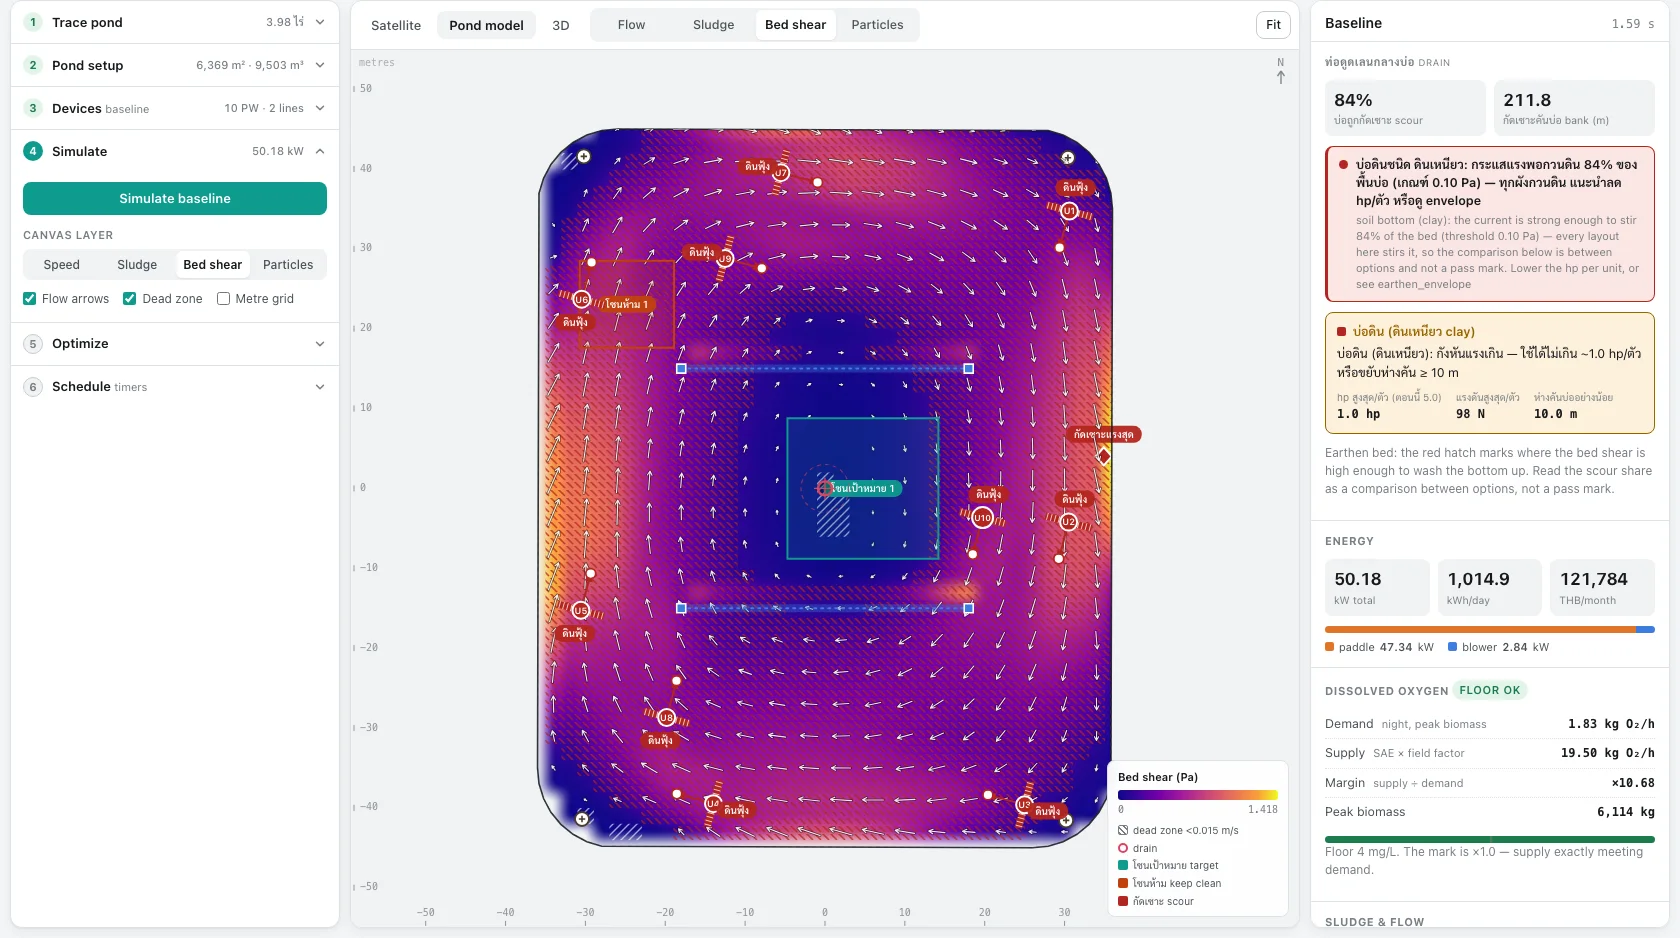
Helps think through where to place aerators and air lines, and shows water flow, where sediment builds up, oxygen and electricity cost, before changing anything at the pond.

  • Still a research model, not advice for farms.
  • We’re looking for farms and experts to help calibrate it against real ponds.
Pond simulation screen showing flow strength on the pond floor as a colour map, flow arrows and aerator positions, with electricity cost and oxygen
Screen from the research tool

More prototypes for partners

Such as tools for nurseries and full trial reports. They aren’t public, because they work with real farm and partner data. Book a call with the team to see a demo.

Book a demo